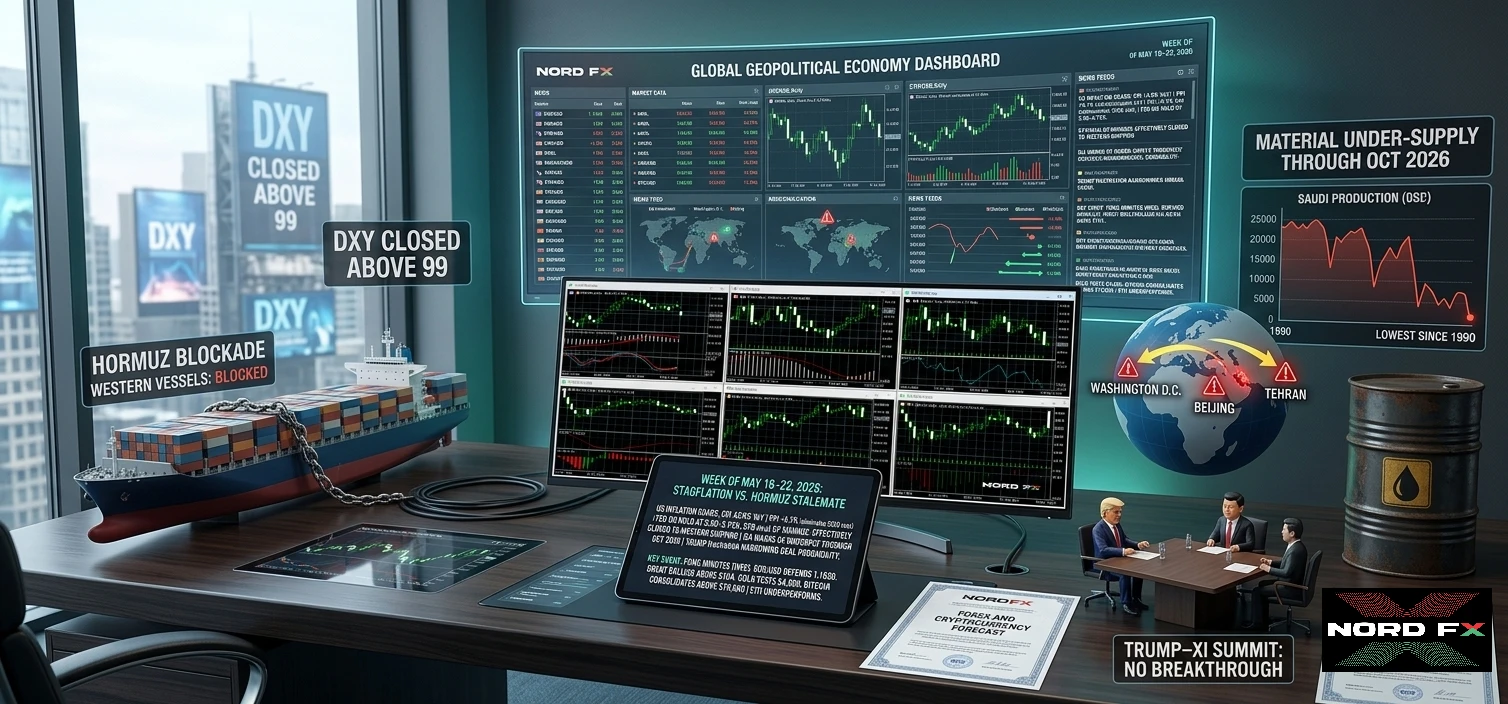
மே 11–15 வாரம் இரண்டு ஒன்றிணைந்த அதிர்ச்சிகளால் வரையறுக்கப்பட்டது: ஒரு பணவீக்கத்துடன் கூடிய தேக்கநிலை அமெரிக்க தரவு மூவிணைப்பு – ஏப்ரல் CPI ஆண்டுக்கு +3.8% (மே 2023 முதல் மிக உயர்ந்தது, BLS மே 12), ஏப்ரல் PPI ஆண்டுக்கு +4.1% (புதன்), மற்றும் சில்லறை விற்பனை முன்னறிவிக்கப்பட்ட +0.4%க்கு எதிராக மாதாந்திர +0.1% (வியாழன்) – மேலும் ஈரான் தூதரகச் சரிவு. ட்ரம்ப்–ஷி பெய்ஜிங் உச்சிமாநாடு (மே 14–15) ஹோர்முஸ் சாதனை எதுவுமின்றி முடிந்தது; பேச்சுவார்த்தைகள் "பெரும் உயிர்ஆதரவில்" இருப்பதாக ட்ரம்ப் திரும்பி வந்து கூறினார். ஈரான் ஜலசந்தி வழியாக சுமார் 30 கப்பல்களை (முக்கியமாக சீன எண்ணெய் கப்பல்கள்) தேர்ந்தெடுத்து அனுமதித்தது, ஆனால் மேற்கத்திய கப்பல்களுக்கு அந்த வழி நடைமுறையில் மூடப்பட்டே உள்ளது. மோதல் அடுத்த மாதம் முடிந்தாலும் கூட, உலக எண்ணெய் சந்தை அக்டோபர் 2026 வரை குறிப்பிடத்தக்க அளவில் குறைவான விநியோகத்துடன் இருக்கக்கூடும் என்று IEA எச்சரித்தது. சவூதி அரேபியா தனது உற்பத்தி 1990 முதல் மிகக் குறைந்த அளவுக்கு சரிந்துள்ளதாக OPECக்குத் தெரிவித்தது.
மே 18–22 வாரத்தில் நுழையும் பேரியல் கட்டமைப்பு: Fed 3.50–3.75%இல் நிறுத்தி வைத்துள்ளது; பணச் சந்தைகள் 2026 வட்டி விகித குறைப்புகள் அனைத்தையும் விலக்கி இப்போது டிசம்பர் வட்டி உயர்வுக்கான சாத்தியக்கூறு ~30% என மதிப்பிடுகின்றன. ECB ஆண்டு இறுதிக்காக மூன்று உயர்வுகளை முழுமையாக விலையிட்டுள்ளது. DXY 99க்கும் மேலாக மூடப்பட்டது – ஒன்பது மாதங்களுக்கும் மேலாகவான அதன் சிறந்த வாராந்திர செயல்திறன்.
இறுதி விலைகள், வெள்ளி மே 15, 2026:
EUR/USD – 1.1669 | பிரெண்ட் கச்சா எண்ணெய் எதிர்கால ஒப்பந்தங்கள் – $107.00 | தங்கம் (XAU/USD) – $4,652 | வெள்ளி (XAG/USD) – $83.48 | பிட்காயின் (BTC/USD) – $79,157 | எத்தீரியம் (ETH/USD) – $2,285
முக்கிய பேரியல் நாட்காட்டி, மே 18–22: அமெரிக்க நிலுவையிலுள்ள வீடு விற்பனை (செவ்); FOMC நிமிடங்கள் (புதன், மே 20) – வாரத்தின் மைய நிகழ்வு; UK & யூரோமண்டல CPI இறுதி (புதன்); அமெரிக்க வீட்டுத் தொடக்கங்கள் & கட்டிட அனுமதிகள் (வியா); பிலடெல்பியா Fed உற்பத்தி குறியீடு (வியா); மிச்சிகன் பல்கலைக்கழக மனநிலை – மே இறுதி (வெள்). Fed பேச்சாளர்கள் யாரும் இல்லை (ஜூன் 17–18 கூட்டத்திற்கான FOMC முந்தைய மௌனக் காலம் மே 29 முதல் தொடங்குகிறது).
EUR/USD
EUR/USD 1.1669இல் மூடப்பட்டது (Investing.com முந்தைய மூடல்), நாள் வரம்பு 1.1617–1.1675, 52-வார வரம்பு 1.1130–1.2079. இந்த ஜோடி தொடர்ந்து ஐந்து நாள் சரிவை பதிவு செய்தது – ஏப்ரல் தொடக்கம் முதல் அதன் மோசமான வாராந்திர ஓட்டம் – சூடான CPI/PPI அச்சிடல்கள் மற்றும் DXY 99க்கும் மேலாக உயர்ந்ததால் தூண்டப்பட்டது. விலை 20-நாள் SMA (~1.1700) மற்றும் 100-நாள் SMA (~1.1660)க்குக் கீழே உடைந்துள்ளது. Investing.com தொழில்நுட்ப சுருக்கம்: அனைத்து உள்நாள் மற்றும் தினசரி கால அளவுகளிலும் வலுவான விற்பனை; RSI 35.8 – அதிக விற்பனைக்கு நெருங்குகிறது ஆனால் இன்னும் தீவிரமாக இல்லை. கட்டமைப்பு ரீதியாக, ஆண்டு இறுதிக்காக மூன்று உயர்வுகளை விலையிட்ட ECB ஒரு தளத்தை வழங்குகிறது, ஆனால் குறுகிய கால வேகம் டாலருக்கு சாதகமாக உள்ளது.
முக்கிய தூண்டிகள்: FOMC நிமிடங்கள் (புதன்) – வட்டி உயர்வு வரம்பு பற்றிய எந்த விவாதமும் டாலருக்கு சாதகமானது, 1.1580–1.1550ஐ இலக்காகக் கொண்டது. யூரோமண்டல CPI இறுதி (புதன்) – 2.2%க்கும் மேலான உறுதிப்படுத்தல் ECB வல்லரசுத்தனத்தை வலுப்படுத்துகிறது. அமெரிக்க நிலுவையிலுள்ள வீடு விற்பனை (செவ்) மற்றும் ஃபில்லி Fed (வியா) கூடுதல் டாலர் சமிக்ஞைகளைச் சேர்க்கின்றன. ஈரான் சாதனை EUR/USDக்கு கூர்மையான சாதகமாக இருக்கும்.
எதிர்ப்பு: 1.1675, 1.1700, 1.1750 ஆதரவு: 1.1600, 1.1580, 1.1483–1.1497
அடிப்படை பார்வை: 1.1675க்குக் கீழே கரடித்தனம். 200-நாள் SMA (~1.1620) மற்றும் 1.1598–1.1603 மண்டலம் முக்கியமான தளங்கள். 1.1580க்குக் கீழே தினசரி மூடல் 1.1483–1.1497ஐத் திறக்கிறது. மீட்சிக்கு FOMC நிமிடங்கள் வல்லரசுத்தனமான ஆச்சரியங்கள் எதையும் வழங்கக்கூடாது மற்றும் யூரோமண்டல CPI ECB உயர்வு எதிர்பார்ப்புகளை வலுப்படுத்த வேண்டும். அடிப்படை வழக்கு: 1.1580–1.1680 வரம்பு.
பிரெண்ட் கச்சா எண்ணெய்
பிரெண்ட் சுமார் $107.00இல் நிலைபெற்றது (Investing.com; Trading Economics: மே 15இல் $106.89, நாளுக்கு +1.11%), முந்தைய மூடலான $101.29 இலிருந்து +~5.7% வாராந்திர ஆதாயம் – மூன்று வாரங்களில் மிகப்பெரிய வாராந்திர முன்னேற்றம். ஈரானுடனான தனது பொறுமை தீர்ந்து வருவதாக ட்ரம்ப் பகிரங்கமாகக் கூறிய பின்னர் வெள்ளியன்று எண்ணெய் கூர்மையாக ஏறியது (+3%+). பிரெண்ட் "6% வாராந்திர ஆதாயத்திற்கு தயாராக" இருந்தது (Investing.com/Reuters மே 15). மார்ச்–ஏப்ரலில் ஹோர்முஸ் ஓட்டம் ~4 மில்லியன் பீப்பாய்/நாள் குறைந்தது என IEA அறிவித்தது; சவூதி உற்பத்தி 1990 முதல் மிகக் குறைந்தது. Investing.com பிரெண்டை அனைத்து கால அளவுகளிலும் வலுவான வாங்கல் என மதிப்பிடுகிறது. 52-வார வரம்பு: $58.72–$126.41.
முக்கிய தூண்டிகள்: அமெரிக்க அழுத்தத்திற்கு ஈரானின் பதில் (எந்த நாளும்). ட்ரம்ப் தீவிரப்படுத்தும் ஆபத்து – டெஹ்ரானுடனான அவரது பகிரங்க விரக்தி விரைவான ஒப்பந்தத்திற்கான சாத்தியக்கூற்றை குறுக்குகிறது. சீனாவின் மத்தியஸ்த பாத்திரம் (ஈரானிய எண்ணெய் இறக்குமதியில் சுமார் 90% பங்கைக் கொண்டுள்ள பெய்ஜிங்கைப் பயன்படுத்த அமெரிக்கா அழுத்தம் கொடுக்கிறது). வாராந்திர EIA சரக்கு (புதன்). Flash PMI தரவு (செவ்) – பலவீனமான உற்பத்தி PMI தேவை எதிர்பார்ப்புகளை மென்மையாக்கலாம்.
எதிர்ப்பு: $110, $114, $118 ஆதரவு: $104, $101, $98
அடிப்படை பார்வை: $104க்கு மேல் காளைத்தனம், தீவிர இருநிலை ஆபத்துடன். விநியோக அதிர்ச்சி (IEA: அக்டோபர் வரை குறை விநியோகம்; சவூதி 36-ஆண்டு குறைந்தபட்சத்தில்) மோதலுக்கு முந்தைய அளவுகளை விட நன்கு உயரே அடிப்படை ஆதரவை வழங்குகிறது. ட்ரம்ப்பின் அதிகரிக்கும் பொறுமையின்மை தீவிரப்படுத்தும் ஆபத்தை உயர்த்துகிறது. அடிப்படை வழக்கு: $104–$112 மேற்புற சாய்வுடன். உறுதிப்படுத்தப்பட்ட ஹோர்முஸ் ஒப்பந்தம் $88–92 நோக்கி $15–20 பின்வாங்கலைத் தூண்டுகிறது; புதுப்பிக்கப்பட்ட தீவிரப்படுத்தல் $118–$126ஐ மீண்டும் இலக்கு வைக்கிறது.
தங்கம் (XAU/USD)
தங்கம் (XAU/USD ஸ்பாட்) Investing.com படி $4,652இல் மூடப்பட்டது (முந்தைய மூடல் $4,652.46; நாள் வரம்பு $4,607–$4,665; 52-வார வரம்பு $3,120–$5,595). இந்த உலோகம் முந்தைய மூடலான $4,730.70 இலிருந்து −1.7% வாராந்திர சரிவைப் பதிவு செய்தது, தொடர்ந்து நான்கு தினசரி இழப்புகளைப் பதிவு செய்தது. சூடான CPI/PPI இணைப்பு வட்டி உயர்வு எதிர்பார்ப்புகளை உயர்த்தியது, மகசூல் இல்லாத தங்கத்தை வைத்திருப்பதன் வாய்ப்பு செலவை பெருக்கியது, அதே நேரத்தில் USD உயர்ந்தது. தங்க இறக்குமதி வரியை 6%இலிருந்து 15%க்கு (மே 13 அறிவிக்கப்பட்டது, Bloomberg) உயர்த்த இந்தியாவின் முடிவு – ஆண்டுக்கு 700–800 டன் தேவையை உள்ளடக்கியது – தேவை எதிர்ப்பு காற்றைச் சேர்த்தது. ட்ரம்ப்–ஷி உச்சிமாநாடு ஹோர்முஸ் சாதனை எதையும் உருவாக்கவில்லை, முக்கிய குறுகிய கால காளைத்தன தூண்டியை அகற்றியது. CME FedWatch: ஜூன் வட்டி மாற்றம் இல்லை என்பதற்கான ~95.8% சாத்தியக்கூறு; டிசம்பர் உயர்வுக்கு ~30%. Investing.com XAU/USDஐ அனைத்து உள்நாள் மற்றும் தினசரி கால அளவுகளிலும் வலுவான விற்பனை என மதிப்பிடுகிறது.
முக்கிய தூண்டிகள்: FOMC நிமிடங்கள் (புதன்) – வல்லரசுத்தனமான தொனி $4,550–$4,500ஐ இலக்காகக் கொண்டது. ஃபில்லி Fed மற்றும் வீட்டுத் தொடக்கங்கள் (வியா). இந்திய வரி கண்காணிப்பு – எந்தத் தலைகீழும் ஒரு நிவாரண மீளுருவாக்கத்தை வழங்குகிறது. ஈரான் தீர்வு குறுகிய காலத்தில் தங்கத்திற்கு எதிர்மறையானது (குறைந்த எண்ணெய் பணவீக்கம் அவசரத்தைக் குறைக்கிறது) ஆனால் நடுத்தர காலத்தில் சாதகமானது (வட்டி குறைப்பு பாதை மீண்டும் திறக்கிறது). Goldman Sachs ஆண்டு இறுதி இலக்கு: $5,400; JPMorgan: $5,900.
எதிர்ப்பு: $4,665, $4,700, $4,760 ஆதரவு: $4,600, $4,550, $4,500
அடிப்படை பார்வை: $4,665க்குக் கீழே கரடித்தனம் முதல் நடுநிலை வரை. $4,700 தளம் சரணடைந்துவிட்டது; $4,600–$4,550 இப்போது குறுகிய கால சோதனை மண்டலமாகும். $4,500க்குக் கீழே ஒரு மூடல் $4,450–$4,400ஐத் திறக்கிறது (பல மாத கட்டமைப்பு ஆதரவு). மீட்சிக்கு FOMC நிமிடங்கள் வல்லரசுத்தனமான ஆச்சரியம் எதையும் வழங்கக்கூடாது மற்றும்/அல்லது உறுதியான ஹோர்முஸ் பதற்றம் தணிப்பு தேவை. நீண்ட கால காளை வழக்கு ($5,400–$5,900 ஆண்டு இறுதி ஆய்வாளர் ஒருமித்த கருத்து) அப்படியே உள்ளது. வாரத்திற்கான அடிப்படை வழக்கு: $4,550–$4,665 வரம்பு.
வெள்ளி (XAG/USD)
வெள்ளி (XAG/USD) வெள்ளியன்று Investing.com படி $83.48இல் மூடப்பட்டது (மே 16ஆம் தேதியின் முந்தைய மூடல்; மே 15இல் நாள் வரம்பு: $77.63–$83.88; 52-வார வரம்பு $31.64–$121.67). முந்தைய வாரம் +5.4% உயர்ந்த பிறகு, USD மீளுருவாக்கம் மற்றும் உயரும் வட்டி உயர்வு எதிர்பார்ப்புகளின் இரட்டை அழுத்தத்தின் கீழ் வெள்ளி நிலத்தை விட்டுக்கொடுத்தது. உள்நாள், வெள்ளி ~$76–$77 வரை சரிந்தது (Trading Economics வெள்ளியன்று ஒரு கட்டத்தில் −9.18% அறிவித்தது), Investing.comஇல் $83.48இல் மூட மீள்வதற்கு முன். இந்த வன்முறையான உள்நாள் நகர்வு அமெரிக்க சூடான PPI தரவு, இந்தியாவின் வெள்ளி வரி உயர்வு 15%, மற்றும் UBS தனது முழு ஆண்டு வெள்ளி முதலீட்டுத் தேவை முன்னறிவிப்பை ~25% (400M இலிருந்து 300M அவுன்ஸ்க்கு) குறைத்ததற்குக் காரணம். கடந்த வாரம் சுருக்கமாக மீண்டும் பெறப்பட்ட 50-நாள் SMA (~$82.67) இப்போது குறுகிய கால எதிர்ப்பாக மீண்டும் விளையாட்டில் உள்ளது. Investing.com XAG/USDஐ தினசரி கால அளவில் நடுநிலை எனவும் (உள்நாள் வலுவான விற்பனை) என மதிப்பிடுகிறது, இது கட்டமைப்பு தொழில்துறை தேவை மற்றும் பேரியல் எதிர்ப்புக் காற்றைப் பிரதிபலிக்கிறது.
முக்கிய தூண்டிகள்: FOMC நிமிடங்கள் (புதன்) – வல்லரசுத்தனமான தொனி $80க்கும் கீழே தள்ளுகிறது. சீனாவில் இருந்து தொழில்துறை தேவை (EV, சூரிய ஒளி). USD பாதை. இந்திய வரி தலைகீழ் கண்காணிப்பு. Flash PMI தரவு – வலுவான உலகளாவிய உற்பத்தி PMI வெள்ளிக்கு சாதகமானது. கட்டமைப்பு விநியோக பற்றாக்குறை (தொடர்ந்து ஆறாவது ஆண்டு திட்டமிடப்பட்டுள்ளது) மற்றும் AI/சூரிய ஒளி தொழில்துறை தேவை நீண்ட கால ஆதரவை வழங்குகின்றன.
எதிர்ப்பு: $84.00, $86.00, $88.00 ஆதரவு: $80.00, $77.00, $75.23 (200-நாள் SMA)
அடிப்படை பார்வை: சிறிய எதிர்மறை சாய்வுடன் நடுநிலை. கூர்மையான உள்நாள் மீளுருவாக்கம் மற்றும் ஏற்ற இறக்கமான வெள்ளி அமர்வு உறுதியற்ற தன்மையைக் குறிக்கின்றன. $82.67இல் 50-நாள் SMA இப்போது மேல் எதிர்ப்பு; $75.23இல் 200-நாள் SMA கட்டமைப்பு தளமாகும். பல எதிர்ப்புக் காற்றுகள் – USD வலிமை, உயரும் வட்டி எதிர்பார்ப்புகள், இந்திய வரி தாக்கம் மற்றும் UBS தேவை குறைப்பு – காளை வழக்கை சவால் செய்கின்றன. வாரத்திற்கான அடிப்படை வழக்கு: $80.00–$84.00 அலைவு, பேரியல் அச்சு இல்லாமல் கீழ் சார்ந்தது.
பிட்காயின் (BTC/USD)
பிட்காயின் வெள்ளியன்று சுமார் $79,157இல் மூடப்பட்டது, $80,165 இலிருந்து −1.3% வாராந்திர சரிவு. வாரம் நன்றாகத் தொடங்கியது: செனட் வங்கிக் குழு CLARITY சட்டத்தை (கிரிப்டோ சந்தை அமைப்பு மசோதா) முன்னேற்றியதால் BTC வியாழன் $82,000 உச்சத்தை எட்டியது (ஜனவரி 2026 முதல் மிக உயர்ந்தது). வெள்ளியன்று பத்திர மகசூல் அதிகரிப்பு அந்த நகர்வைக் கூர்மையாகத் தலைகீழாக்கியது: BTC $78,600 அளவுக்குக் குறைந்தது, $360M க்கும் அதிகமான லீவரேஜ் லாங் நிலைகள் கலைக்கப்பட்டன (CoinGlass படி, மார்ச் இறுதியில் இருந்து மிகப்பெரிய அழித்தொழிப்பு). தொடர்ந்து மூன்றாவது வாரமாக 200-நாள் EMA (~$82,228) விலையை மேற்கூரையாகக் கொண்டிருந்தது. சங்கிலி-ஆதார அடிப்படைகள் அப்படியே உள்ளன: பரிமாற்ற இருப்புக்கள் 7 ஆண்டு குறைந்தபட்சத்தில்; BlackRock IBIT ~812,000 BTC (~$62B) வைத்துள்ளது; ஒட்டுமொத்த ETF நிகர உள்வரவுகள்: $58.5B. சந்தை மதிப்பு: ~$1.33T.
முக்கிய தூண்டிகள்: FOMC நிமிடங்கள் (புதன்) – வல்லரசுத்தனமான தொனி கிரிப்டோ மீதான பத்திர மகசூல் அழுத்தத்தை நிலைநிறுத்துகிறது. CLARITY சட்டத்தின் செனட் முன்னேற்றம் – முழுமையான நிறைவேற்ற வாக்கெடுப்பு ஒரு பெரிய நடுத்தர கால சாதகமாகும். ஈரான் அமைதி ஒப்பந்தம் = ஆபத்து-உள் ஊக்கம். $79,000 நிலை குறுகிய கால தளம்; $78,500க்குக் கீழே தினசரி மூடல் $76,960ஐ மீண்டும் சோதிக்கும் ஆபத்து உள்ளது.
எதிர்ப்பு: $81,000, $82,228 (200-நாள் EMA), $84,000 ஆதரவு: $79,000, $78,500, $76,960
அடிப்படை பார்வை: $79,000க்கு மேல் எச்சரிக்கையாக காளைத்தனம். சாதனை-குறைந்த பரிமாற்ற விநியோகம், ETF உள்வரவுகளில் $58.5B மற்றும் வரலாற்று திமிங்கல சேமிப்பு கட்டமைப்பு ஏலத்தை பராமரிக்கின்றன. $82,000க்கு மேலான தோல்வியுற்ற வியாழன் முன்னேற்றம் மற்றும் வெள்ளி டெலிவரேஜிங் நிகழ்வு $82,228இல் 200-நாள் EMAஐ ஒரு வலிமையான கூரையாக உறுதிப்படுத்துகின்றன. CLARITY சட்ட முன்னேற்றம் முக்கிய குறுகிய கால சட்டமன்ற தூண்டியாகும். அடிப்படை வழக்கு: $78,500–$82,228 அலைவு. $82,228க்கு மேலான உறுதிப்படுத்தப்பட்ட மூடல் $84,000–$86,000ஐத் திறக்கிறது.
எத்தீரியம் (ETH/USD)
எத்தீரியம் $2,285இல் மூடப்பட்டது (Investing.com முந்தைய மூடல் $2,284.96; 52-வார வரம்பு $1,388–$4,956), முந்தைய மூடலான $2,284.70 இலிருந்து வாரத்தில் கிட்டத்தட்ட மாறவில்லை. இருப்பினும், வாராந்திர அமர்வு வன்முறையான உள்நாள் ஊசலாட்டங்களை மறைத்தது: CLARITY சட்ட நம்பிக்கையின் அடிப்படையில் ETH புதன்–வியாழன் ~$2,412க்கு உயர்ந்தது (ஏப்ரல் இறுதி முதல் மிக உயர்ந்தது), வெள்ளி பத்திர மகசூல் உச்சத்துடன் தலைகீழாக்கப்படுவதற்கு முன். $5.9M TrustedVolumes சுரண்டல் மற்றும் Arbitrumஇல் $30.8M ETH முடக்கப்பட்டது (வட கொரியா ஹேக்கர்கள்) ஆகியவற்றால் சுமை ஏற்றப்பட்டு ETH ஒப்பீட்டு அடிப்படையில் BTCஐ விட மோசமாகச் செயல்பட்டது – இரண்டும் முறையானவை இல்லை, ஆனால் இரண்டும் உணர்வை எடைபோட்டன. 50-நாள் EMA (~$2,361) மற்றும் 200-நாள் MA (~$2,367) தொடர்ந்து $6-அகலமான இறுக்கமான எதிர்ப்புக் கொத்தாக உருவாக்குகின்றன, இது மே மாதத்தில் ஒவ்வொரு ETH மீளுருவாக்கத்தையும் நிராகரித்துள்ளது. Investing.com ETHஐ உள்நாள் மற்றும் தினசரி கால அளவுகளில் வலுவான விற்பனை என மதிப்பிடுகிறது.
முக்கிய தூண்டிகள்: FOMC நிமிடங்கள் (புதன்) – ETH BTCஐ விட வட்டி-உணர்திறன் கொண்டது; வல்லரசுத்தனமான தொனி $2,150ஐ இலக்காகக் கொண்டது. CLARITY சட்டம் – மேலதிக முன்னேற்றம் ETHக்கு சாதகமானது மற்றும் ஒழுங்குமுறை நிச்சயமற்ற தன்மையைக் குறைக்கிறது. ஸ்பாட் ETH ETF ஓட்டங்கள் (BlackRock ETHA, Fidelity FETH) ஒரு கட்டமைப்பு தளத்தை வழங்குகின்றன. எந்தப் புதிய சுரண்டல் தலைப்புச் செய்திகளும் ETHஐ விகிதாசாரமற்ற அளவில் எடைபோடும்.
எதிர்ப்பு: $2,320, $2,361–$2,367 (MA கொத்து), $2,412 ஆதரவு: $2,200, $2,150, $2,108
அடிப்படை பார்வை: $2,320க்குக் கீழே சிறிய எதிர்மறை சார்புடன் நடுநிலை. $2,361–$2,367 MA கொத்து இப்போது மே மாதத்தில் தொடர்ந்து மூன்று ETH மீளுருவாக்கங்களை நிராகரித்துள்ளது. $2,150 நிலை அடுத்த முக்கியமான ஆதரவாகும்; அதற்குக் கீழே ஒரு மூடல் $2,108 மற்றும் சாத்தியமாக $2,000ஐத் திறக்கிறது. $2,367க்கு மேல் வாராந்திர மூடல் – FOMC புறா-தனம் அல்லது ஒரு ஹோர்முஸ் சாதனை தேவை – $2,412–$2,460ஐ இலக்காகக் கொள்கிறது. அடிப்படை வழக்கு: $2,150–$2,320 வரம்பு, ஆபத்து-வெளி பேரியல் சூழலில் ETH BTCஐ விட தொடர்ந்து குறைவாகச் செயல்பட வாய்ப்புள்ளது.
முடிவு
மே 18–22 வர்த்தக வாரத்தை இரண்டு சக்திகள் வரையறுக்கின்றன. முதலில், பணவீக்கத்துடன் கூடிய தேக்கநிலை அமெரிக்க தரவு உண்மை – CPI +3.8%, PPI +4.1%, பலவீனமான சில்லறை விற்பனை – 2026 Fed வட்டி குறைப்புகளை அகற்றி, ஒரு வட்டி உயர்வை மேசையில் உறுதியாக வைத்துள்ளது (CME: ~30% டிசம்பர் சாத்தியக்கூறு). இரண்டாவதாக, ஹோர்முஸ் ஜலசந்தி முட்டுக்கட்டை தொடர்கிறது, தோல்வியுற்ற பெய்ஜிங் உச்சிமாநாட்டிற்குப் பிறகு ட்ரம்ப்பின் பொறுமை வெளிப்படையாகச் சிதைகிறது. FOMC நிமிடங்கள் (புதன்) வாரத்தின் மைய தூண்டியாகும்: வல்லரசுத்தனமான மொழி டாலர் மீளுருவாக்கத்தை விரைவுபடுத்துகிறது மற்றும் தங்கம், வெள்ளி மற்றும் கிரிப்டோவில் விற்பனையை நீட்டிக்கிறது; நடுநிலை-முதல்-புறா வாசிப்பு அனைத்து கருவிகளிலும் ஒரு நிவாரண மீளுருவாக்கத்தைத் தூண்டுகிறது. ஃபில்லி Fed (வியா) மற்றும் UMich மனநிலை இறுதி (வெள்) கூடுதல் தேவை-பக்க சமிக்ஞைகளை வழங்குகின்றன.
EUR/USD ஐந்து நாள் சரிவுக்குப் பிறகு ~1.1620இல் 200-நாள் SMAஐ பாதுகாக்கிறது; 1.1580க்குக் கீழே உடைப்பு 1.1483–1.1497ஐத் திறக்கிறது. பிரெண்ட் $104க்கு மேல் காளை சாய்வைக் கொண்டுள்ளது, டெஹ்ரான் மீதான ட்ரம்ப்பின் அதிகரிக்கும் பொறுமையின்மை தீர்வை விட தீவிரப்படுத்தும் ஆபத்தை உயர்த்துகிறது. தங்கம் $4,700 தளத்தை இழந்த பிறகு $4,600–$4,550 ஆதரவைச் சோதிக்கிறது – ஒரு வல்லரசுத்தனமான FOMC நிமிடங்கள் அச்சிடல் $4,500ஐ அச்சுறுத்துகிறது. வெள்ளி ஒரு வெடிக்கும் உள்நாள் சூழலில் வழிசெலுத்துகிறது: 50-நாள் SMA ($82.67) உடனடி மேற்புற இலக்கு; 200-நாள் SMA ($75.23) கட்டமைப்பு தளமாகும். பிட்காயின் $79,000க்கு மேல் ஒருங்கிணைகிறது, 200-நாள் EMA ($82,228) தீர்க்கமான முன்னேற்ற நிலையாகும்; CLARITY சட்ட வேகம் முதன்மை தூண்டியாகும். எத்தீரியம் BTCஐ விட குறைவாகச் செயல்படுகிறது மற்றும் $2,361–$2,367 MA கொத்தை முக்கிய கூரையாக எதிர்கொள்கிறது, $2,150 கீழ்நோக்கிய அச்சாக உள்ளது.
NordFX பகுப்பாய்வுக் குழு
பொறுப்புத் துறப்பு: இந்தப் பொருட்கள் ஒரு முதலீட்டு பரிந்துரை அல்லது நிதிச் சந்தைகளில் வேலை செய்வதற்கான வழிகாட்டி அல்ல, இவை தகவல் நோக்கங்களுக்காக மட்டுமே. நிதிச் சந்தைகளில் வர்த்தகம் செய்வது ஆபத்தானது மற்றும் டெபாசிட் செய்யப்பட்ட நிதியின் முழுமையான இழப்புக்கு வழிவகுக்கலாம்.
திரும்பிச் செல்லவும் திரும்பிச் செல்லவும்
