What are chart patterns and how do traders use them?
Chart patterns are visual formations on price charts that help traders identify potential trend reversals or continuations and make decisions based on price behavior rather than predictions.
Key takeaways
- Chart patterns reflect market psychology, not random shapes
- They work best when combined with context like trend and volume
- Most patterns fail without confirmation signals
- Execution matters more than pattern recognition
- Understanding false signals is critical for consistent results
What Are Chart Patterns
Chart patterns are recurring formations created by price movements on a chart. They are used in technical analysis to anticipate what the market might do next based on historical behavior.
At their core, chart patterns represent the interaction between buyers and sellers. When price forms a recognizable structure, it often signals that the market is preparing for a move.
Patterns are typically divided into two categories:
- Reversal patterns, which indicate a potential change in trend
- Continuation patterns, which suggest the current trend may continue
Unlike indicators, chart patterns rely purely on price action. This makes them especially useful for traders who prefer clean charts and direct market interpretation.
Types of Chart Patterns
Understanding the purpose behind each pattern is more important than memorizing shapes.
Reversal patterns
These appear when a trend is losing momentum and may change direction.
Examples include:
They typically form after extended trends and signal exhaustion.
Continuation patterns
These occur during a pause in the trend before it resumes.
Examples include:
They reflect temporary consolidation rather than a full reversal.
The key difference is context. The same shape can behave differently depending on where it appears in the trend.
7 Most Important Chart Patterns
Below is a practical overview of the most widely used chart patterns and how traders interpret them.
Pattern | Type | What it Signals | Common Failure |
Head and Shoulders | Reversal | Trend change from bullish to bearish | Weak neckline breakout |
Double Top | Reversal | Resistance holding, potential drop | Breakout above resistance |
Double Bottom | Reversal | Support holding, potential rise | Breakdown below support |
Ascending Triangle | Continuation | Buyers gaining strength | False breakout above resistance |
Descending Triangle | Continuation | Sellers gaining strength | Reversal instead of breakdown |
Flag | Continuation | Trend pause before continuation | Overextended move leads to reversal |
Wedge | Reversal/Continuation | Weakening trend momentum | Misinterpreted direction |
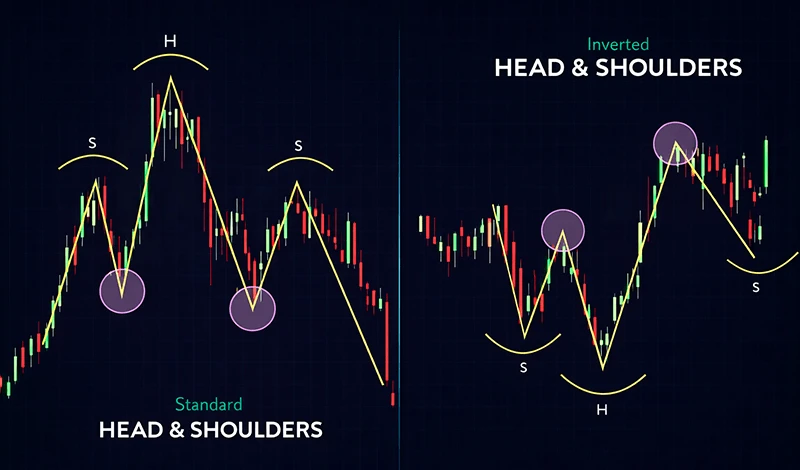
Head and Shoulders
This is one of the most reliable reversal patterns. It forms after an uptrend and signals a potential shift to a downtrend.
Traders typically wait for a break of the neckline before entering a trade. Premature entries often lead to losses.
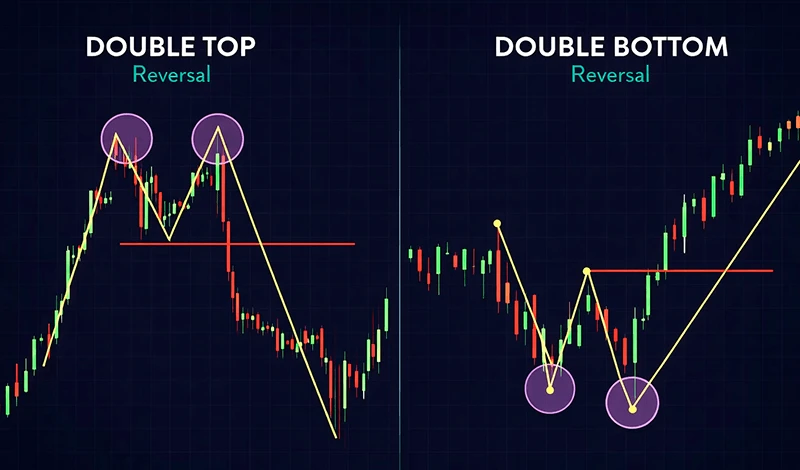
Double Top and Double Bottom
These patterns highlight strong support or resistance levels.
A double top suggests that buyers failed to push the price higher twice, indicating potential weakness. A double bottom shows the opposite.
The key is confirmation. Many traders enter too early before the level is clearly broken.
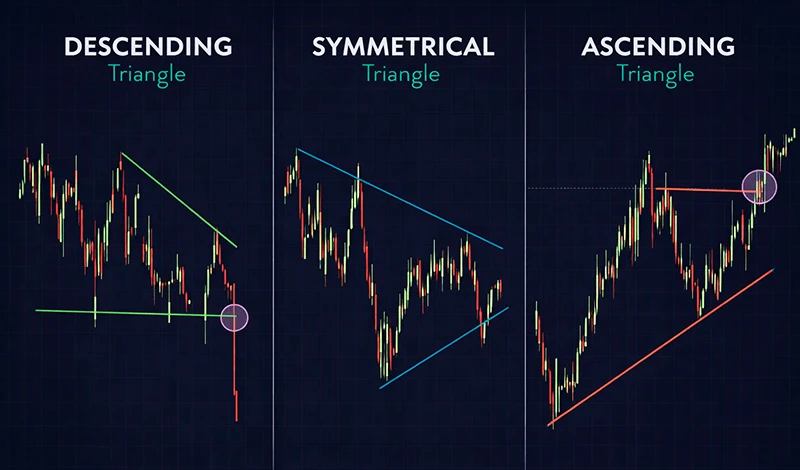
Triangles
Triangles reflect consolidation and tightening price action.
- Ascending triangle indicates bullish pressure
- Descending triangle indicates bearish pressure
Breakouts from triangles can be strong, but false breakouts are common in low liquidity conditions.
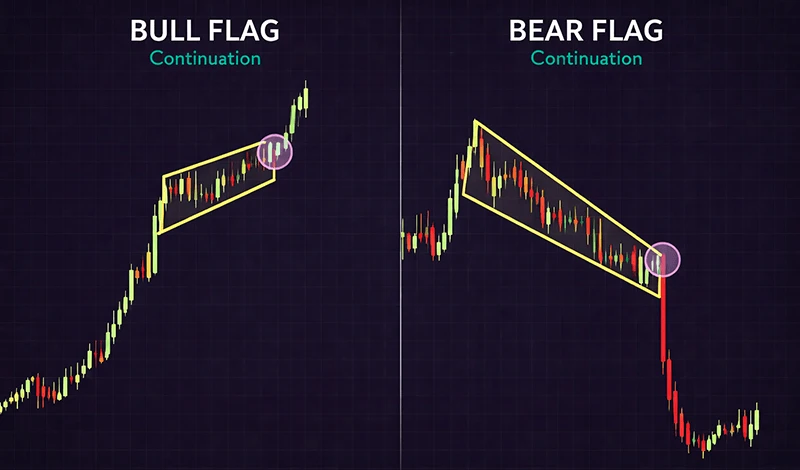
Flags
Flags are short-term continuation patterns that appear after strong price moves.
They represent a pause before the trend continues. The stronger the initial move, the more reliable the flag.
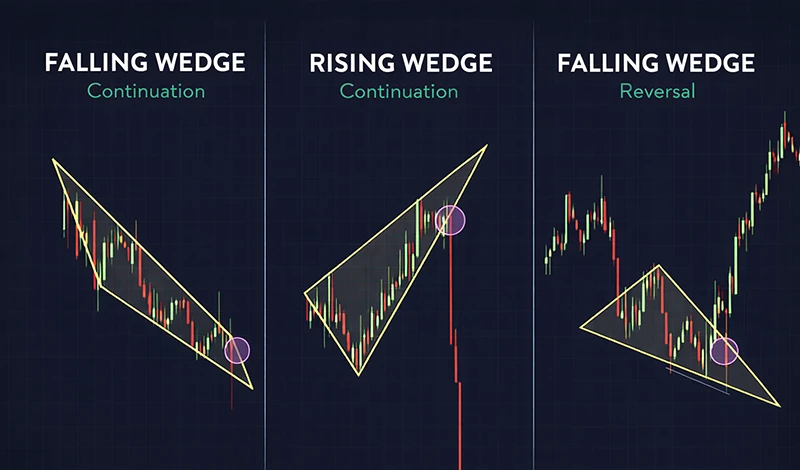
Wedges
Wedges can signal both continuation and reversal depending on direction.
A rising wedge often indicates weakening bullish momentum, while a falling wedge may signal a potential upward move.
How to Trade Chart Patterns Step-by-Step
Recognizing a pattern is only the first step. Execution determines profitability.
Step 1: Identify the context
Before trading any pattern, determine:
- Current trend
- Market structure
- Key support and resistance levels
Patterns without context are unreliable.
Step 2: Wait for confirmation
A pattern is not valid until:
- A breakout occurs
- Price closes beyond a key level
Based on observed MT4/MT5 trading behavior, many losing trades come from entering before confirmation.
Step 3: Define entry and stop-loss
Typical approach:
- Entry after breakout or retest
- Stop-loss beyond the structure
This helps manage risk if the pattern fails.
Step 4: Set realistic targets
Targets are often based on:
- Pattern height
- Previous support/resistance
Avoid unrealistic expectations. Patterns provide probabilities, not guarantees.
Why Chart Patterns Fail
Chart patterns are not always reliable. Understanding failure conditions is essential.
False breakouts
One of the most common issues.
Price briefly breaks a level, triggers entries, and then reverses. This often happens in volatile markets.
Low liquidity
When there are not enough orders in the market:
- Price can jump over levels
- Patterns become less reliable
News and macro events
Sudden news can invalidate any pattern instantly.
Technical setups do not account for unexpected events.
Overfitting patterns
Many traders try to see patterns where none exist.
Observed patterns on MT4/MT5 execution show that over-analysis often leads to poor decisions.
Real Example
Consider a double bottom forming on a major asset.
Price tests a support level twice but fails to break lower. This suggests buyers are defending the level.
A trader waits for:
- Break above the neckline
- Strong candle close
Instead of entering at the second bottom, the trader waits for confirmation.
This approach reduces the risk of entering a false pattern.
Internal trading behavior shows that traders who wait for confirmation tend to have better consistency than those who anticipate the move.
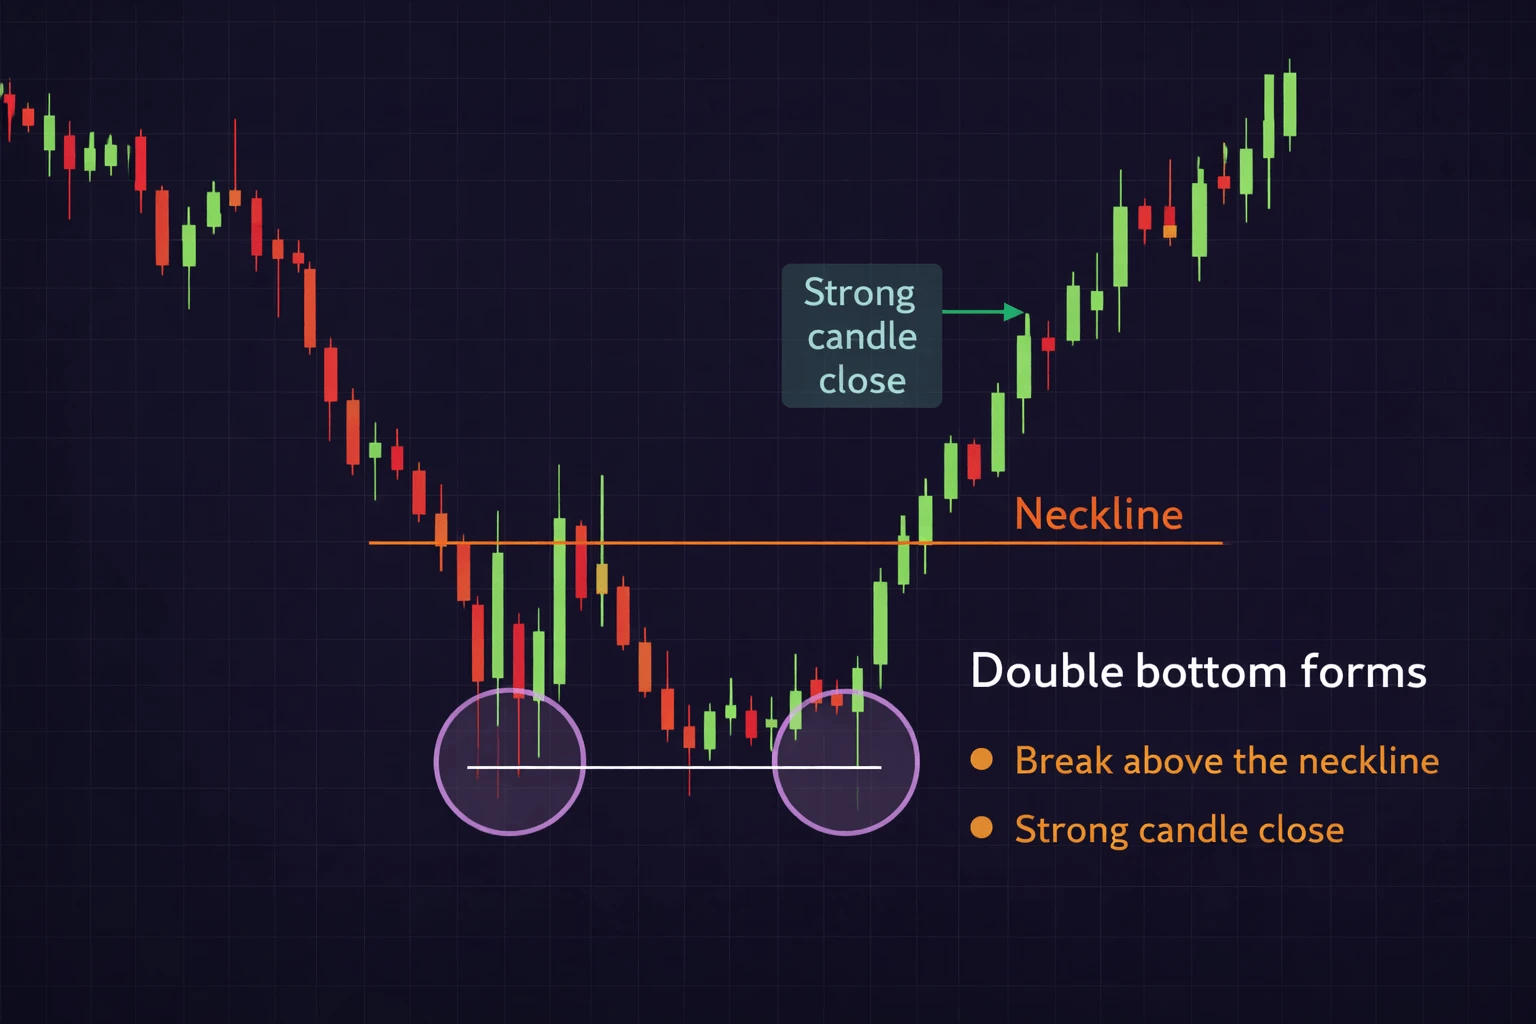
Chart Patterns vs Indicators
Chart patterns and indicators serve different purposes.
Patterns focus on price structure, while indicators use mathematical calculations.
When to use chart patterns
- Trending markets
- Clear support and resistance
- Clean price action
When to combine with indicators
- To confirm momentum
- To filter false signals
For example:
- RSI can confirm overbought or oversold conditions
- Volume can validate breakouts
Relying only on patterns without confirmation increases risk.
Common Mistakes Traders Make
Many traders struggle with chart patterns not because the patterns do not work, but because of how they are used.
Trading every pattern
Not all patterns are worth trading. Quality matters more than quantity.
Ignoring market context
A pattern inside a strong opposing trend is less reliable.
Entering too early
Anticipating a breakout instead of waiting for confirmation is one of the most common mistakes.
Poor risk management
Even the best pattern can fail. Without proper risk control, losses can grow quickly.
FAQ: Chart Patterns in Trading
What are chart patterns in trading?
Chart patterns are formations created by price movements that help traders identify potential future market direction.
Are chart patterns reliable?
They can be effective when used with confirmation and proper risk management, but they are not guaranteed signals.
Which chart pattern is the most reliable?
Head and Shoulders is often considered one of the most reliable reversal patterns, but its success depends on proper confirmation.
Can beginners use chart patterns?
Yes, but beginners should focus on a few simple patterns and understand how they behave in different market conditions.
Do chart patterns work in all markets?
They can be applied to different markets including stocks, commodities, and crypto, but effectiveness depends on liquidity and volatility.
Why do chart patterns fail?
They fail due to false breakouts, low liquidity, news events, and incorrect interpretation.
Meet the Author
Vanessa Polson is a marketing manager at NordFX with over twelve years of experience in online marketing within the financial services industry. She has developed and executed data-driven campaigns across search, social, and display channels in in-house environments. Her work focuses on translating complex financial products and trading tools into clear, practical educational content, giving her a broad and well-rounded view of the global trading landscape.
Connect with Vanessa on LinkedIn.
Bumalik Bumalik
